
Open most technical B2B and software marketing dashboards and you will see 30 metrics fighting for attention. Impressions next to pipeline, click-through rate next to MQL count, bounce rate next to revenue. Everything looks busy. Almost nothing helps you decide what to do tomorrow. The dashboard problem is not which metrics exist, it is which ones actually belong in the room with whoever is reading the report.
The fix is not a new tool, it is a clear structure. Decide who looks at the dashboard, what decisions they make from it, and put exactly those metrics in front of them. For the full framework on which 12 KPIs every B2B team should track, see our complete B2B Marketing KPIs guide. This post focuses on the dashboard layer above that: how to structure, what to leave out, and which tool to use.
The Three-Tier Dashboard Structure
Every workable B2B dashboard has three tiers, each with a different audience and a different decision the data should drive. Mixing tiers is the most common reason dashboards become unusable.
The key rule is that no metric belongs in two tiers. If your CMO sees CTR every month, they will eventually ask why a 0.3-point drop happened, and someone has to spend a day finding out. CTR belongs in Tier 3, where the person who can actually fix it sees it daily.
What to Put on the Executive Dashboard (Tier 1)
The executive dashboard answers one question: is marketing producing pipeline and revenue this quarter, and is the cost reasonable? Anything that does not move that question is noise.
The five metrics that belong here are marketing-sourced pipeline (deals where marketing was the first touch), marketing-influenced revenue (closed-won deals where marketing touched the buying group), customer acquisition cost broken out by segment, marketing ROI as revenue divided by marketing spend, and the trend versus the same quarter last year. Five tiles, big numbers, traffic light colors. No micro-charts.
25% of B2B marketing budget is spent on campaigns that look productive in dashboards but do not drive revenue. The cost of measuring the wrong metrics is one in four marketing dollars wasted.
What to Put on the Team Dashboard (Tier 2)
The team dashboard is where weekly decisions happen. Pause this campaign, double down on that channel, redirect spend from Y to X. The KPIs are mid-funnel: MQL volume per channel, MQL-to-SQL conversion, cost per lead per channel, and the funnel velocity from first touch to opportunity.
Two things make the team dashboard work. First, every metric is broken out by channel - one MQL number is useless, twelve channel-specific MQL numbers tell you what is working. Second, every metric has a target line drawn against it. A CPL of 80 EUR means nothing in isolation. A CPL of 80 EUR against a 60 EUR target is a problem. A CPL of 80 EUR against a 120 EUR target is a win.
According to HubSpot's State of Marketing Report 2026, the top metrics marketers track are lead quality and MQLs (39%), lead-to-customer conversion rate (34%), ROI (31%), and customer acquisition cost (30%). The Tier 2 dashboard should reflect that hierarchy: lead quality first, conversion rates second, cost-efficiency third.
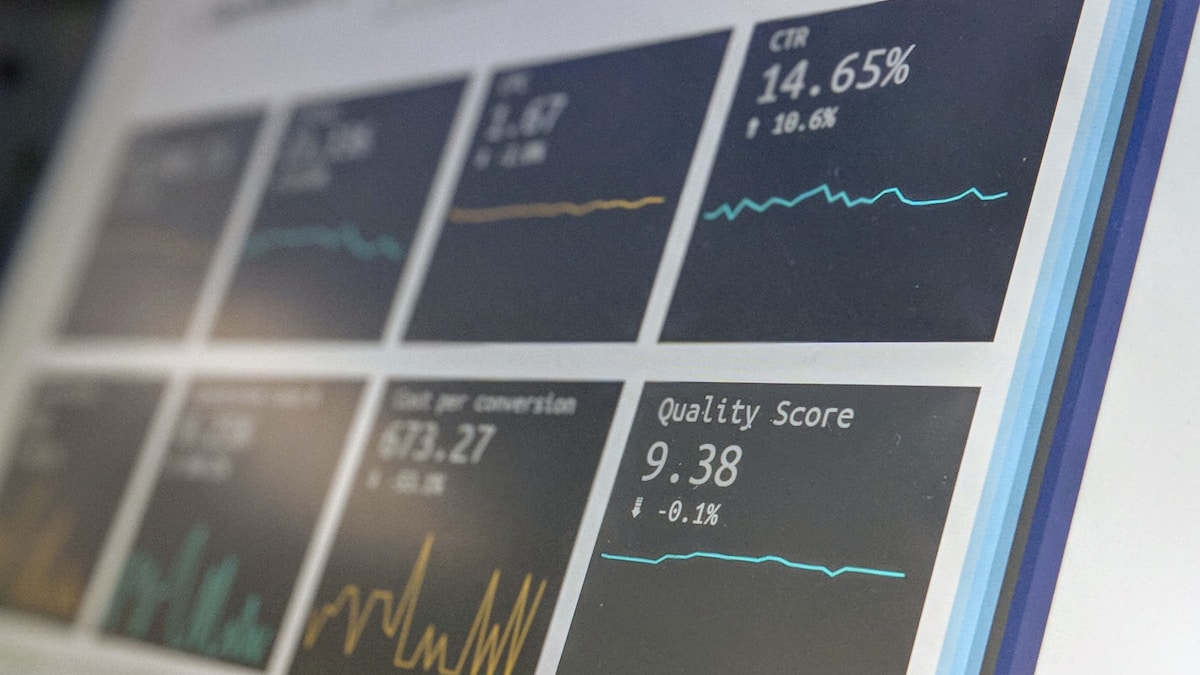
What to Put on the Channel Dashboard (Tier 3)
Channel dashboards are operational. A Google Ads manager looks at this every morning before changing bids. The metrics are the ones the algorithm and the human can act on within 24 hours: click-through rate, cost per click, quality score, conversion rate from ad click to form submit. Same logic for SEO (positions, CTR by query, indexed pages), email (open rate, click rate, list health) and LinkedIn (impression share, frequency, audience size).
The Tier 3 dashboard is allowed to have 15 to 20 metrics because the person reading it can do something with each one. Just keep them inside the channel - no Tier 1 metrics should sneak in here, otherwise the channel manager starts optimizing for ROI which is not their job.
Which Tool to Use
For most B2B SaaS, the realistic choice is between three tools. Looker Studio (formerly Google Data Studio) is free, plugs into GA4, Google Ads, and BigQuery natively, and works for Tier 2 and Tier 3 dashboards. Limitations show up at Tier 1 because pulling closed-won data from a CRM into Looker requires a connector or a manual export.
HubSpot Reports works if your CRM is HubSpot. Tier 1 and Tier 2 dashboards build themselves once attribution is set up. The downside is that pulling in non-HubSpot channel data (LinkedIn Ads spend, email tool data) gets clunky.
Tableau or Power BI are the right answer when you have an analyst on the team and revenue data lives across multiple systems. Both can blend CRM, ad platforms, and product usage into a single Tier 1 view. Skip them if you do not have someone who can maintain the data model. A neglected Tableau dashboard rots faster than a Looker one.
Common Dashboard Mistakes
One dashboard for everyone. The single most common failure. The CMO scrolls past CTR and conversion rates looking for revenue, the channel manager scrolls past pipeline looking for CPC. Both leave annoyed. Build three dashboards.
Vanity metrics on the executive dashboard. Impressions, reach, social engagement. They go up and to the right reliably and they say nothing about whether the company will hit its number. Cut them from Tier 1, keep them in Tier 3 if at all.
No targets, just numbers. A standalone metric is data, not insight. Every tile needs a target line, a trend versus last period, or a benchmark. Without a reference point the reader cannot tell whether the number is good or bad.
Building it once and forgetting. A dashboard built in Q1 will be miscalibrated by Q3. New channels launch, attribution windows change, the company changes ICP. Audit the dashboard quarterly: which tiles did anyone actually look at, which decisions did the data drive, what is missing.
Conclusion
A B2B marketing dashboard is a decision-making tool, not a reporting trophy. Three tiers, different audiences, different cadences, no metric in two places. Five revenue numbers for the executive view, twelve channel-segmented funnel metrics for the team, twenty operational metrics for the channel managers. Done well, the dashboard answers questions before they are asked. Done badly, it is the prettiest 25% of marketing spend you ever wasted. For the underlying KPI framework that feeds these dashboards, see our complete B2B Marketing KPIs guide.
Frequently Asked Questions
How many metrics should a Tier 1 executive dashboard have?
Five, plus or minus one. The dashboard should fit on a single screen with each tile readable from across the room. If the CMO has to scroll, the dashboard is too long. If they have to think about which tile to look at first, it is too cluttered. Pipeline, influenced revenue, CAC, ROI, and trend versus prior period covers everything that matters at this level.
Should the dashboard show real-time data or refreshed daily?
Tier 1 monthly is fine, real-time would create noise. Tier 2 weekly with daily refresh, so trends become visible without constant alarms. Tier 3 daily refresh is essential because channel managers are tuning bids and budgets that day. Real-time data is rarely worth the extra cost outside of paid ads dashboards during active campaign launches.
Who owns the dashboard inside the marketing team?
One person, full stop. Usually the head of marketing operations or a senior generalist. Without a single owner, dashboards become the collective responsibility of nobody, and they rot. The owner does not have to build every tile, but they own the structure, the metric definitions, and the quarterly audit. If you do not have someone, the dashboard is more or less guaranteed to drift within a year.